
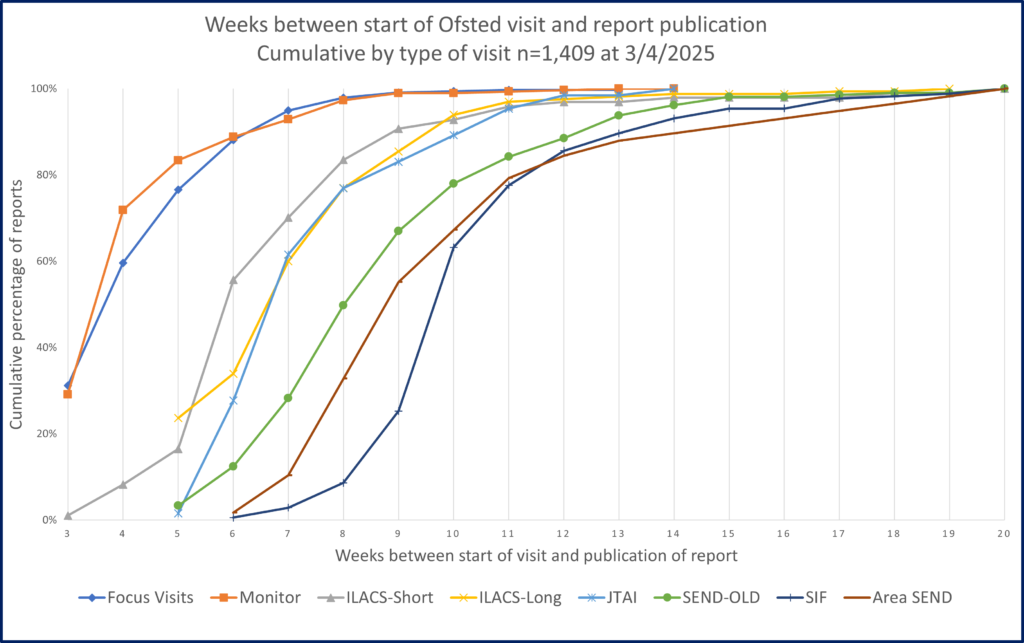
The time it takes for Ofsted to publish a report from the start of the inspection
Table 2: Elapsed time in days from start of a visit to publication of report by type of visit as at 03/04/2025
Our friends at LIIA, working with D2I have produced more Ofsted analysis Ofsted inspections Power BI dashboard (external link hosted by LIIA).
The dashboard has five pages and covers ILACS and SEND inspections, with all manner of filters and visualisations available.
| Time in days | Maximum | 80th centile | Average | Minimum |
|---|---|---|---|---|
| All Focus | 105 | 45 | 35.7 | 23 |
| All Monitor | 98 | 38 | 34.5 | 20 |
| ILACS short | 156 | 63 | 52.7 | 22 |
| ILACS long | 137 | 65 | 55.8 | 37 |
| JTAI | 101 | 66 | 57.2 | 42 |
| SEND1&2 | 149 | 79 | 67.0 | 36 |
| AreaSEND1 | 149 | 88 | 76.2 | 45 |
| All SIF | 225 | 86 | 79.3 | 49 |
| Total | 225 | 70 | 52 | 20 |
Chart 1: Waiting times for report publication by type of Ofsted visit: all published reports since start of SIF inspections
All the data on these pages have been produced by SESLIP analysis of information published at Ofsted’s report pages, which involves manual data transfer and is therefore subject to errors and omissions. If you spot anything that looks wrong, please contact Richard Tyndall 07880-787007